title: “Tahoe-100M and the Virtual Cell: What 100 Million Perturbed Cells Can (and Can’t) Tell You” description: “Tahoe-100M mapped how 1,100 drugs change gene expression across 50 cancer cell lines. scBaseCount harmonized 500M+ public single-cell profiles. The Virtual Cell Challenge grades models on predicting responses they haven’t seen. State is the model that tries. Here’s where the data live, how to query them, and where the limits are.” date: “2026-09-19” lastUpdated: “2026-09-19” author: “Seb” tags: [“single-cell”, “virtual cell”, “Tahoe-100M”, “cancer biology”, “AI in biology”, “scRNA-seq”, “bioinformatics”]
Tahoe-100M and the Virtual Cell: What 100 Million Perturbed Cells Can (and Can’t) Tell You
A few weeks ago I kept running into “virtual cell” in bioRxiv titles and conference talks. It sounds like a finished simulator — you put in a drug, a gene knock-out, whatever, and out comes the cell’s response. The reality is more interesting and more honest than that.
Tahoe-100M is the best example of why. It’s not a simulator. It’s a record: 100 million transcriptomic snapshots of cancer cells after they were exposed to drugs. Huge, open, and specific about what it actually measured.
This post covers four things people mix up: Tahoe-100M, scBaseCount, the Virtual Cell Challenge, and State. I’ll show you where the data live, how to pull a slice of it, and where the limits are. Numbers and links were checked against the sources on 2026-09-18.
Key Takeaways – Tahoe-100M has 100M+ transcriptomic profiles from 1,100 drugs across 50 cancer cell lines, all CC0 licensed and streamable from Hugging Face – scBaseCount is a separate project: 500M+ cells, 75 tissues, 27 organisms, observational (not a drug screen) – The Virtual Cell Challenge is a benchmark, not an atlas. The 2026 edition is zero-shot: no challenge-specific training data – State is the predictive model built on top of this data. It needs a basal transcriptome as input and carries a non-commercial license on the model weights – Retrieval (what was measured) and inference (what would happen) are two different categories of answer with very different reliability
What Tahoe-100M actually is
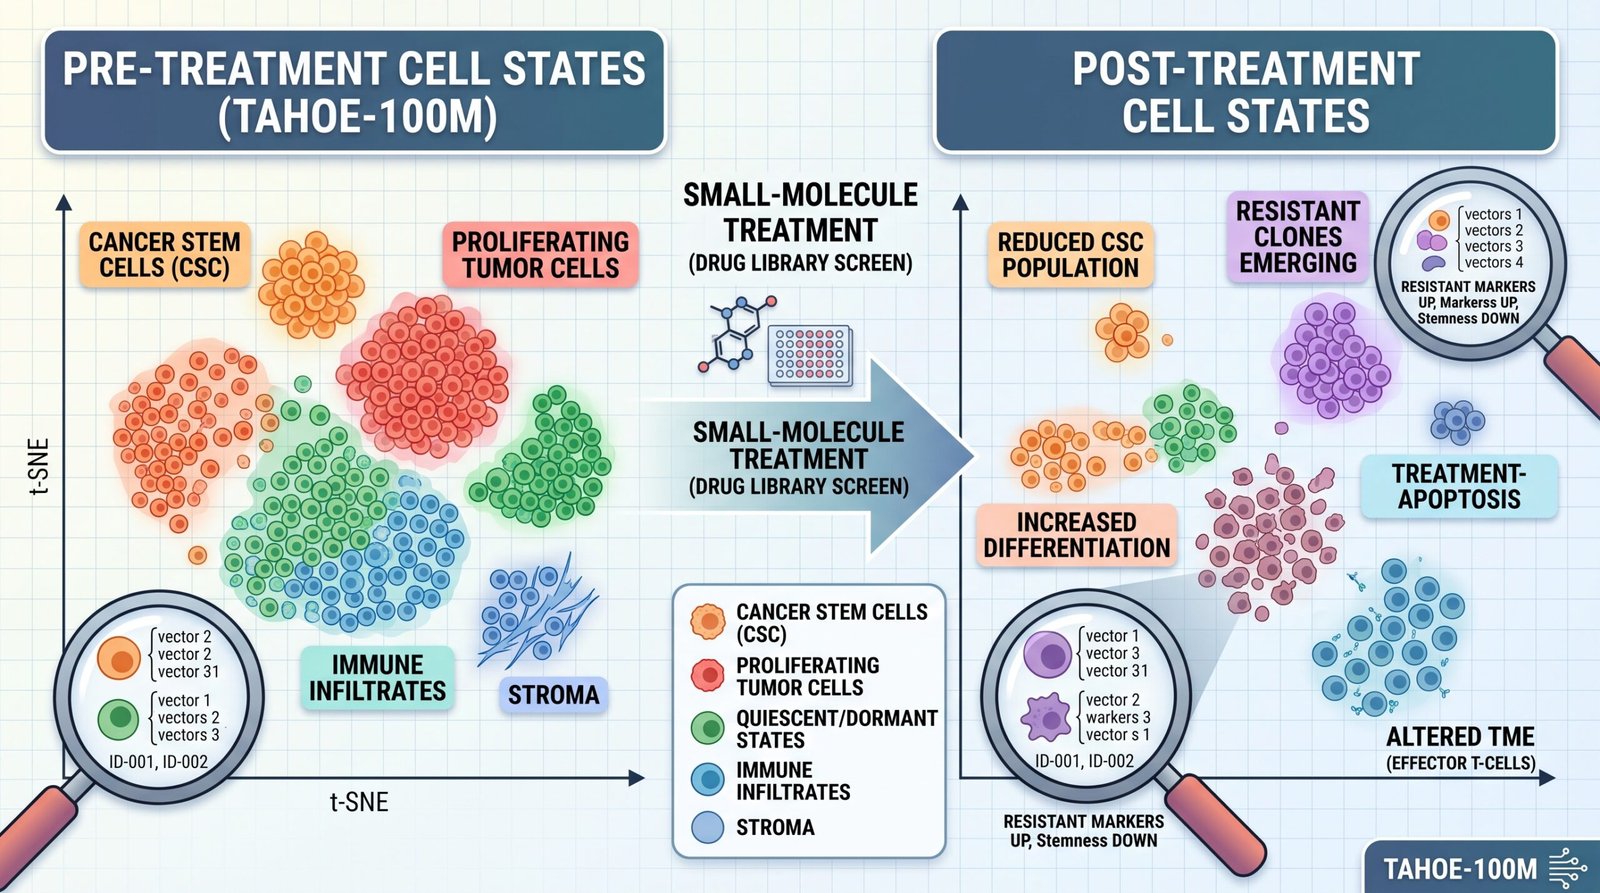
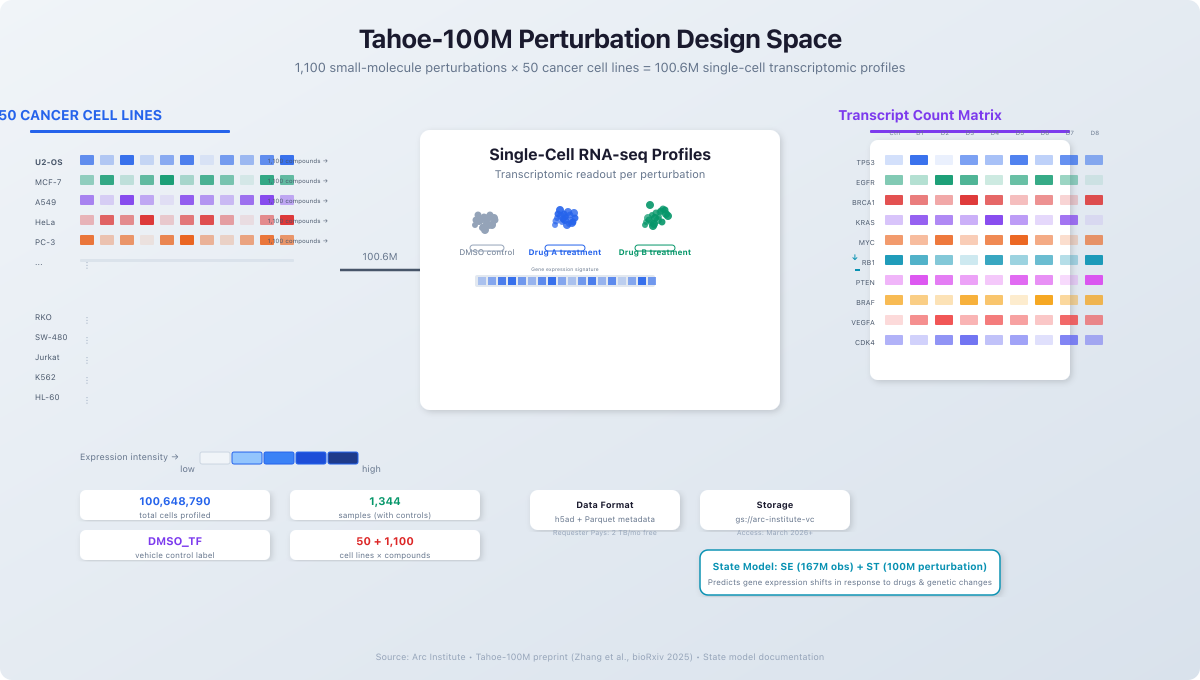
The Tahoe-100M preprint (Zhang et al., bioRxiv) describes it as “a giga-scale single-cell atlas of 100 million transcriptomic profiles measuring how each of 1,100 small-molecule perturbations impact cells across 50 cancer cell lines.”
That last part matters. It’s 50 cancer cell lines, not 150. I’ve seen that number quoted wrong more than once.
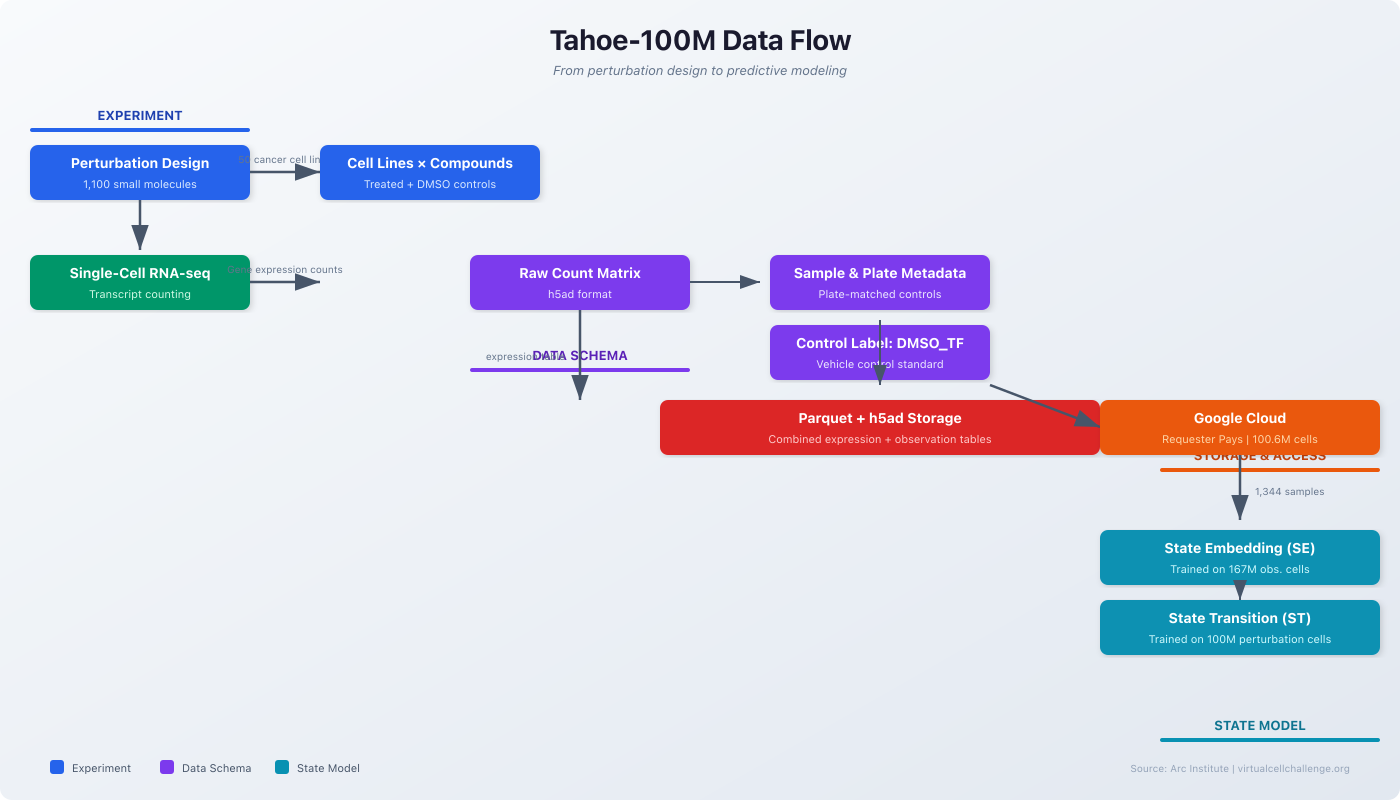
The experiment used the Mosaic platform from Tahoe Therapeutics, which pools cells from many models into one experiment and sorts out each cell’s response afterward. The result is roughly 60,000 experiments worth of data, released as a single open dataset. Arc’s current documentation reports 100,648,790 cells and 1,344 samples. Format is h5ad count matrices with Parquet metadata.
Where the data live and how to get them
Hugging Face is the fastest starting point. The tahoebio/Tahoe-100M page has a data viewer showing the expression_data subset at 95.6M rows, with columns for genes, expression counts, drug, cell line ID, and moa-fine (mechanism of action). The full dataset is 429 GB, licensed CC0 1.0.
Google Cloud is where the full data live for serious analysis. In March 2026, Arc moved the atlas to a Google Cloud Marketplace bucket: gs://arc-institute-virtual-cell-atlas. The old buckets were deleted on March 31, 2026, so any tutorial pointing at the old path will fail. Current access instructions are in the atlas GitHub repo. It’s Requester Pays, with up to 2 TB/month of free egress from a subscribed Google Cloud project.
LaminDB is good for browsing without downloading. Arc maintains a public mirror that loads without a login, showing 311,231 artifacts when I checked — including scBaseCount reference files for organisms from maize to chimpanzee.
The license
Everything in the atlas is CC0 1.0. Copyright waived as far as law allows. Download it, train on it, build a company on it. Cite the paper anyway — that’s convention, not law. Patents and clinical use are separate questions the license doesn’t settle.
Worth being clear: the dataset is CC0. The State model weights are not. More on that below.
How to query it without downloading 429 GB
The dataset card’s quickstart streams the data instead of pulling everything locally:
from datasets import load_dataset

# Stream without downloading the full dataset
ds = load_dataset("tahoebio/Tahoe-100M", "expression_data",
                  split="train", streaming=True)

first_cell = next(iter(ds))
print(first_cell)
One record is one cell: tokenized gene IDs, aligned expression counts, the drug it saw, and the cell line it came from.
For a real question, check the metadata tables first, then filter:
# Cellosaurus IDs and drug names live in the metadata tables. Look yours up first.
cell_lines = load_dataset("tahoebio/Tahoe-100M", "cell_line_metadata", split="train")
drugs = load_dataset("tahoebio/Tahoe-100M", "drug_metadata", split="train")

# Filter: treated cells vs plate-matched DMSO controls
hits = ds.filter(lambda row: row["cell_line_id"] == "CVCL_0023"  # A549 -- verify in the table
                 and row["drug"] in ("8-Hydroxyquinoline", "DMSO_TF"))
DMSO_TF is the vehicle control. Use plate-matched controls, because batch effects are real. The card’s loading_data.ipynb tutorial converts a filtered subset to AnnData, which gets you into scanpy.
One thing worth knowing before you scale up: streaming .filter() scans the entire stream. Fine for exploring, slow at scale. For a real analysis, use the Parquet files on Google Cloud and let a query engine handle the filtering.
What you can actually ask this dataset
Tahoe answers one version of “what happens when I target gene X”: the chemical version. Cells saw a drug; here’s every gene’s expression before and after. You can see which genes move, which pathways respond, and whether the response holds across all 50 lines or just some.
Compare that with DepMap. DepMap tells you whether knocking out a gene kills the cell (essentiality). Tahoe tells you what the cell looks like transcriptionally after a chemical perturbation (mechanism). Lethality versus mechanism. Different questions that need different datasets.
Coverage has edges. The 50 lines lean toward common cancer models — lung, colorectal, pancreatic. Prostate isn’t among them as far as I can tell, but verify in the cell_line_metadata table before trusting anyone’s memory, including mine. If your line isn’t in the 50, Tahoe has no measured answer for you.
The core panel spans three concentrations: 0.05, 0.5, and 5 uM across 50 lines and 379 drugs. Three points is not a dose-response curve. Coverage across the full 1,100-drug release is thinner at the higher concentrations.
scBaseCount: the breadth dataset
This is where people get confused. scBaseCount is a separate project from Tahoe-100M — it just lives in the same Arc Virtual Cell Atlas.
Where Tahoe is a curated perturbation screen, scBaseCount is an observational database. AI agents mine public archives (SRA and similar), uniformly process the single-cell RNA-seq they find, and publish standardized counts plus metadata. Current size: over 500 million cells, 27 organisms, 75 tissues, still growing. (Youngblut et al., bioRxiv)
So the split is: – Tahoe-100M for measured drug responses in its 50 cancer lines – scBaseCount for breadth across tissues and organisms, including things like prostate tissue, healthy and diseased, that turn up in public archives
One distinction to keep clear: scBaseCount is observational by design. Individual studies in it may include treated samples, but it wasn’t built as a systematic perturbation screen.
The Virtual Cell Challenge: an honest benchmark
The challenge is not a dataset you use for your own project. It’s a benchmark: it hands out measured data, withholds some of it, and grades models on how well they predict the withheld part.
2025 edition: about 300,000 single-cell profiles from the H1 human embryonic stem cell line, 300 CRISPRi perturbations, roughly 1,000 cells each. Split: 150 perturbations for training, 50 for validation, 100 held out. Scored on differential-expression accuracy, perturbation discrimination, and mean absolute error. Models got some H1 data to learn from (few-shot).
2026 edition: six CRISPRi datasets from six cancer cell lines across different tissues. No challenge-specific training set. Entrants get basal profiles from non-targeting guides plus target gene IDs, and predict the post-CRISPRi profiles. Zero-shot generalization across contexts. The design was published as a Cell commentary in September 2026.
Models can train on anything public. The challenge just measures whether prediction of unseen responses actually works.
That’s the right question. A 2026 benchmarking study found virtual cell performance drops noticeably under strict evaluation conditions (arXiv 2604.27646). A leaderboard number tells you how a method did under that benchmark’s conditions. It doesn’t tell you how it will do in your biological context.
State: the predictive model
State is Arc’s virtual cell model. Two transformer modules: a State Embedding model trained on 167 million observational cells, and a State Transition model trained on over 100 million perturbed cells (chemical, signaling, and genetic). You give it a control transcriptome plus a perturbation, and it predicts the perturbed transcriptome.
Weights and code are open:
– arcinstitute on Hugging Face — including the Tahoe-100M-trained transition model
– GitHub repo
– Install: uv tool install arc-state
The repo links Colab notebooks for training the transition model and for inference with the Tahoe-100M-trained version.
Two things to check before building on State:
First, State needs a basal transcriptome as input. No control single-cell data from a relevant context, no prediction. That’s not a workaround; it’s a hard requirement.
Second, the model weights carry a non-commercial license. You may not use the State model or any derivative for anything other than non-commercial purposes without a separate written license from Arc. The dataset (CC0) and the model weights (restricted) are two different things — keep them separate in your project planning.
There are claims that State can take a novel drug’s molecular structure or mechanism of action and predict the cellular effect, meaning generalization from chemistry to transcriptional response rather than interpolation between drugs it saw during training. Check that against the State preprint and the inference Colab before building on it. Tahoe is moving in the same direction: their 300-million-cell Parse GigaLab project targets predictions of therapeutic response, mechanism of action, and patient variability.
Retrieval vs. inference: two different categories of answer
Worth making explicit before you start building something.
Tahoe-100M, scBaseCount, and the challenge data answer: what was measured? If your cell line or drug isn’t in the dataset, there’s nothing to report. These are ground truth with defined scope.
State and similar models answer: what would happen if…? — for combinations nobody has measured. That second kind of answer gets less reliable the further the input is from the training distribution. A model trained on 50 cancer lines and 1,100 drugs is extrapolating when you ask about a drug it never saw.
Neither category is inherently better. They’re different. Treating a model prediction as a measurement is where projects run into trouble.
Quick comparison: which resource for which question?
| Resource | Best for | Watch out for |
|---|---|---|
| Tahoe-100M | Measured drug responses at scale; training perturbation models; MoA grouping via moa-fine annotations |
50 cancer lines only; no healthy tissue; RNA only; mostly chemical perturbations |
| scBaseCount | Breadth: 500M+ cells, 75 tissues, 27 organisms; standardized public data; reference context for your own data | Observational by design; not a systematic perturbation screen; quality varies by source study |
| Virtual Cell Challenge data | Honest grading of predictive models; 2026 edition tests zero-shot generalization | Narrow by design; a benchmark, not an atlas |
| State (virtual cell model) | Predicting unmeasured perturbation responses; open weights and code | Needs a basal transcriptome; accuracy decays off-distribution; non-commercial license on weights |
What I’d actually use this for
Based on the data structure and annotations in the dataset:
- Target triage. Check what perturbing related pathways does across 50 lines before paying for a wet-lab screen. The
moa-finecolumn makes this queryable. - Drug repurposing. Drugs with similar transcriptional fingerprints may share mechanisms. Group by fingerprint, see what clusters.
- Combination hypotheses. Two drugs moving complementary pathways in the same line is a combination worth testing in the lab.
- Training your own perturbation model. 100M+ profiles are the data models like State are built on.
- Reference context. Annotate your own single-cell data against scBaseCount to understand what’s typical for a tissue.
What I’d want to see next
I haven’t seen anyone build these yet:
- Genotype plus drug in, transcriptomic response out, no sequencing required. Drug sensitivity from genotype exists (models trained on GDSC screens). Transcriptomic response from a basal profile exists (State). The missing piece is the combination: mutation profile and drug in, predicted response out, without any sequencing up front.
- Denser dose-response. The core panel spans three concentrations (0.05, 0.5, 5 uM). Three points is not a curve.
- Time courses and drug combinations. Everything in the open release is a single 24-hour timepoint, single agents. No 6/24/72-hour trajectories, no drug A plus drug B. Tahoe, Arc, and Biohub have a 120M+ cell follow-up in the works that may address this.
- In vivo and organoid data at this scale. The GENEVA study ran in vivo mosaic tumors and organoids, and the sequencing data are public on GEO (GSE283335). What’s missing is systematic perturbation screens in PDX and organoid models at atlas scale.
- A query layer with provenance. Measured results labeled measured, predictions labeled predicted, silence where there’s nothing. I haven’t seen a tool that draws that line cleanly.
- Prospective validation as standard practice. The loop where a model nominates experiments and the lab runs them. Reviews advocate for it. It’s still the exception.
Where to start if you’re new to this
Disclaimer: This post is for educational purposes only. Nothing here is clinical guidance or a recommendation for any therapeutic use. I’m not affiliated with Tahoe Therapeutics, Arc Institute, or any of the projects mentioned.
If you’re not a bioinformatician, the Hugging Face data viewer is the lowest-friction entry point. Browse the columns and see what a single cell record looks like before touching any code.
If you’re comfortable with Python, start with the streaming code above. Filter to one cell line and one drug. Compare treated cells against the DMSO_TF control. That afternoon will teach you more about the data structure than any overview.
If you’re planning a serious analysis, read the GitHub README for current GCS paths before writing any download scripts. The March 2026 migration means old tutorials are broken.
I hope this was useful for sorting out what these resources actually are. What are you using Tahoe-100M for, or thinking about using it for? Curious whether people are hitting the 50-cell-line limit or finding the data useful in other ways. Let me know in the comments.
References
- Tahoe-100M on Hugging Face
- Tahoe-100M preprint: Zhang et al., bioRxiv 2025.02.20.639398
- Arc Virtual Cell Atlas
- Atlas data access and GCS migration (GitHub)
- scBaseCount documentation
- scBaseCount preprint: Youngblut et al., bioRxiv 2025.02.27.640494
- LaminDB atlas mirror
- Arc State tool page and State on GitHub
- State weights (Hugging Face)
- State preprint (PDF)
- State model license
- Virtual Cell Challenge 2026 design: Cell, Sept 2026
- Virtual Cell Challenge primer (Hugging Face blog)
- Benchmarking virtual cell models in-the-wild: arXiv 2604.27646
- GENEVA platform paper, Nature Cancer (sequencing data on GEO: GSE283335)
- Tahoe/Arc/Biohub 120M+ cell follow-up dataset (Jan 2026)
- Conservation-divergence audit of Tahoe-100M, incl. dose design: ResearchSquare
Draft, 2026-09-19. Numbers checked against linked sources on 2026-09-18.